What Is Market Basket Analysis?
Market Basket Analysis is a technique which identifies the strength of association between pairs of products purchased together and identify patterns of co-occurrence. A co-occurrence is when two or more things take place together.
Market Basket Analysis creates If-Then scenario rules, for example, if item A is purchased then item B is likely to be purchased. The rules are probabilistic in nature or, in other words, they are derived from the frequencies of co-occurrence in the observations. Frequency is the proportion of baskets that contain the items of interest. The rules can be used in pricing strategies, product placement, and various types of cross-selling strategies.
How Market Basket Analysis Works
In order to make it easier to understand, think of Market Basket Analysis in terms of shopping at a supermarket. Market Basket Analysis takes data at transaction level, which lists all items bought by a customer in a single purchase. The technique determines relationships of what products were purchased with which other product(s). These relationships are then used to build profiles containing If-Then rules of the items purchased.
The rules could be written as:

The If part of the rule (the {A} above) is known as the antecedent and the THEN part of the rule is known as the consequent (the {B} above). The antecedent is the condition and the consequent is the result. The association rule has three measures that express the degree of confidence in the rule, Support, Confidence, and Lift.
For example, you are in a supermarket to buy milk. Based on the analysis, are you more likely to buy apples or cheese in the same transaction than somebody who did not buy milk?
In the following table (table 1), there are nine baskets containing varying combinations of pasta, lemon, bread, and orange.

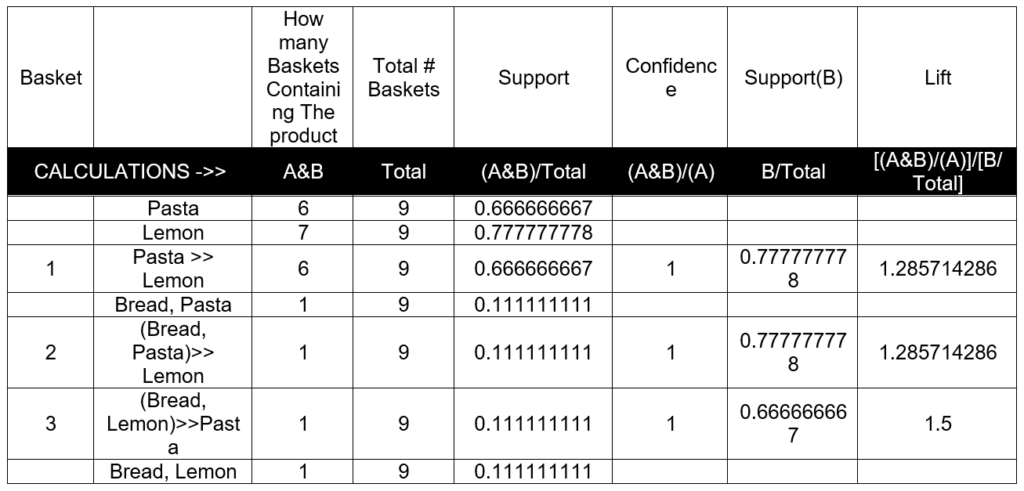
The next step is to determine the relationships and the rules. For explanation purposes, the
following table shows some of the relationships. In total there are 22 rules for the nine baskets.

Let us try to understand how each metrics is calculated.
The first metric is Support
- Support: The probability that the puller(antecedent) and pulled(consequent) items are present in a transaction.
- Support(X)=No. of baskets in which X appears/No. of total baskets.
- Support(Y)=No. of baskets in which Y appears/No. of total baskets.
- Support of pair, Support(X∩Y) = No. of baskets in which both X and Y appear/No. of total baskets.
- Support is interpreted as fraction of transactions that contain both X and Y.
In the above example,
Support for basket1 = (No. of times Pasta and Lemon bought together in a basket)/No. of Baskets
= 6/9
=0.666666667
Support for basket2=(No. of times Bread,Pasta and Lemon bought together)/No. of Baskets
=1/9
=0.111111111
Support for basket3 =( No. of times Bread,Lemon and Pasta bought together)/No. of Baskets
=1/9
=0.111111111
The second metric is Confidence
- The probability that the pulled item is also present in a transaction with the puller item.
- Confidence = Support(X∩Y)/Support(X).
- Confidence is a measure for how frequently the item Y is bought when a customer buys X.
- Confidence is interpreted as How often items in Y appear in transactions that contain X only.
Confidence for basket1 = Support of Pasta and Lemon bought together/Support of Pasta bought
= (6/9)/(6/9)
=1
Same thing in the other words can be explained as
Confidence for basket1 =No. of times Pasta and Lemon bought together in a basket) /Number of times of Pasta bought in a basket
Because the denominator for both the cases is same which is the total number of baskets.
Confidence for basket2=(No. of times Bread,Pasta and Lemon bought together)/No. of times Bread,Pasta is bought in a basket
=1/1
=1
Confidence for basket3 =( No. of times Bread,Lemon and Pasta bought together)/No. of times Bread,Lemon is bought in a basket
=1/1
=1
The third metric called the lift or lift ratio
- It is the ratio of confidence to expected confidence.
- Expected confidence is the confidence divided by the frequency of Y. The Lift tells us how much better a rule is at predicting the result than just assuming the result in the first place. Greater lift values indicate stronger associations
- If X and Y have no interdependence then lift is ideally 1. Lift is measure of likelihood of both X and Y appearing in a basket as compared to pure random chance.
- It is interpreted as: How much our confidence has increased that Y will be purchased given that A was purchased.
Lift for basket1 = Confidence of Pasta and Lemon bought together/Support of Lemon bought
= (6/9)/(7/9)
= 1.2857
Lift for basket2 = (Confidence of Bread,Pasta and Lemon bought together)/Support of Lemon bought
= (1/1)/(7/9)
= 1.2857
Lift for basket3 = (Confidence of Bread,Lemon and Pasta bought together)/Support of Pasta bought
= (1/1)/(6/9)
=1.5
[Reference] : webfocusinfocenter
